
The stats love the Kings.
(Note: From time to time, I’ll take a break from proposing new sports ideas. This is one of those times.)
While the hockey stats revolution is still about a decade or so behind baseball, there are still some pretty telling stats in our toolbox today. My favorites are Corsi, Fenwick, and PDO.
Here’s a description of each from the awesome Stats.HockeyAnalysis.com:
- Fenwick = Shots + Missed Shots
- FF% = Fenwick For% = Fenwick For / (Fenwick For + Fenwick Against)
- Corsi = Shot Attempts = Shots + Missed Shots + Blocked Shots
- CF% = Corsi For% = Corsi For / (Corsi For + Corsi Against)
- PDO = Shooting Percentage + Save Percentage while on the ice
There’s obviously a lot of overlap, but we’ll just ignore that for now. The main takeaway is that possession and shots are extremely important.
I compiled the FF%, CF%, and PDO on all 30 NHL teams from the 2013-14 regular season and standardized them into a z-score. For Fenwick and Corsi, a higher z-score is good. For PDO, a lower z-score is good.
I averaged these figures up in the “Total” column ((FF + CF – PDO) /3) and sorted them by that metric. To compared them to the actual regular season results, I also added the regular season standings points and goal differential.
| Team | FF% | FFZ | CF% | CFZ | PDO | PDOZ | Total | Points | Goal Dif |
| Los Angeles | 56.1 | 1.83 | 56.8 | 2.01 | 1000 | 0.00 | 1.28 | 100 | 32 |
| New Jersey | 53.6 | 1.07 | 54.4 | 1.29 | 985 | -1.33 | 1.23 | 88 | -11 |
| Chicago | 55.4 | 1.62 | 55.5 | 1.62 | 999 | -0.09 | 1.11 | 107 | 47 |
| San Jose | 54.6 | 1.38 | 53.7 | 1.09 | 998 | -0.18 | 0.88 | 111 | 49 |
| Florida | 50.8 | 0.23 | 51 | 0.28 | 980 | -1.77 | 0.76 | 66 | -72 |
| NY Rangers | 52.6 | 0.77 | 52.4 | 0.70 | 997 | -0.27 | 0.58 | 96 | 25 |
| St. Louis | 53.7 | 1.10 | 53.1 | 0.91 | 1007 | 0.62 | 0.46 | 111 | 57 |
| Vancouver | 51.6 | 0.47 | 51.3 | 0.37 | 995 | -0.44 | 0.43 | 83 | -27 |
| Ottawa | 51 | 0.29 | 52.4 | 0.70 | 997 | -0.27 | 0.42 | 88 | -29 |
| NY Islanders | 49.1 | -0.28 | 49.4 | -0.19 | 984 | -1.42 | 0.32 | 79 | -42 |
| Detroit | 51.5 | 0.44 | 51.5 | 0.43 | 1000 | 0.00 | 0.29 | 93 | -8 |
| Winnipeg | 50.5 | 0.14 | 50.1 | 0.02 | 994 | -0.53 | 0.23 | 84 | -10 |
| Carolina | 49.6 | -0.13 | 50.3 | 0.08 | 994 | -0.53 | 0.16 | 83 | -23 |
| Nashville | 49.4 | -0.19 | 48.5 | -0.46 | 989 | -0.97 | 0.11 | 88 | -26 |
| Dallas | 50.9 | 0.26 | 50.5 | 0.14 | 1002 | 0.18 | 0.07 | 91 | 7 |
| Tampa Bay | 51.3 | 0.38 | 51 | 0.28 | 1007 | 0.62 | 0.02 | 101 | 25 |
| Boston | 53.4 | 1.01 | 53.9 | 1.15 | 1025 | 2.21 | -0.02 | 117 | 84 |
| Phoenix | 50 | -0.01 | 50.5 | 0.14 | 1003 | 0.27 | -0.05 | 89 | -15 |
| Philadelphia | 49.2 | -0.25 | 50 | -0.01 | 1003 | 0.27 | -0.18 | 94 | 1 |
| Pittsburgh | 49.2 | -0.25 | 48.7 | -0.40 | 1001 | 0.09 | -0.24 | 109 | 42 |
| Calgary | 47.7 | -0.70 | 46.3 | -1.11 | 988 | -1.06 | -0.25 | 77 | -32 |
| Columbus | 49.8 | -0.07 | 49.9 | -0.04 | 1008 | 0.71 | -0.27 | 93 | 15 |
| Minnesota | 48.8 | -0.37 | 48.6 | -0.43 | 1010 | 0.89 | -0.56 | 98 | 1 |
| Washington | 47.1 | -0.88 | 47.7 | -0.69 | 1002 | 0.18 | -0.58 | 90 | -5 |
| Montreal | 47.9 | -0.64 | 46.7 | -0.99 | 1005 | 0.44 | -0.69 | 100 | 11 |
| Anaheim | 50.1 | 0.02 | 49.8 | -0.07 | 1024 | 2.13 | -0.72 | 116 | 57 |
| Edmonton | 44.1 | -1.78 | 44.3 | -1.70 | 990 | -0.89 | -0.87 | 67 | -67 |
| Buffalo | 42.8 | -2.17 | 43 | -2.09 | 982 | -1.59 | -0.89 | 52 | -91 |
| Colorado | 46.7 | -1.00 | 47 | -0.90 | 1018 | 1.59 | -1.17 | 112 | 30 |
| Toronto | 42.3 | -2.32 | 42.9 | -2.12 | 1013 | 1.15 | -1.86 | 84 | -25 |
It’s not hard to see why Toronto and their notoriously anti-analytics front office fell off the rails, but how did Colorado manage to achieve a No. 1 seed in the West? (Answer: Unsustainably over-achieving goaltending from Semyon Varlamov.)
For the sake of comparing these stats to regular season results, here’s how Total looks plotted against goal differential:
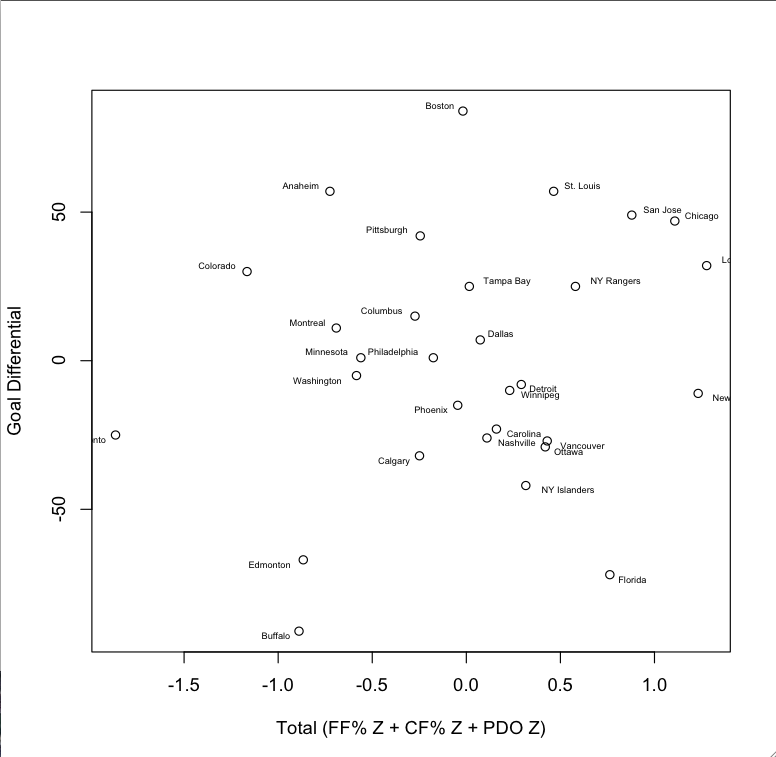
(Sorry some of those are cut off. The far left is Toronto, and the far right are Los Angeles and New Jersey.)
The correlation is only .1845, which suggests that these metrics should probably only be used as a guideline in telling us what teams may have over- and under-achieved this season relative to their actual performance.
First round match-ups
Ok, so how do these teams’ stats compare for the first round match-ups?
| Home Ice | Total | Road Ice | Total | Difference |
| Colorado | -1.171 | Minnesota | -0.512 | -0.66 |
| St. Louis | 0.106 | Chicago | 0.905 | -0.80 |
| Anaheim | -0.575 | Dallas | 0.289 | -0.86 |
| San Jose | 0.926 | Los Angeles | 1.233 | -0.31 |
| Boston | 0.101 | Detroit | 0.356 | -0.25 |
| Tampa Bay | 0.018 | Montreal | -0.377 | 0.40 |
| Pittsburgh | -0.200 | Columbus | -0.483 | 0.28 |
| NY Rangers | 0.753 | Philadelphia | -0.244 | 1.00 |
In the West, every matchup’s lower seed has a higher total, which suggests that upsets could be rampant. Most notably, Minnesota and Dallas have a considerable edge over the two No. 1 seeds. And whoever emerges from the San Jose vs. Los Angeles showdown (two of the three highest Totals in the playoffs) should be a serious contender to make the Stanley Cup Finals.
In the East, it’s a bit more chalk, but again, a No. 1 seed (Boston) has a lower total than its opponent (Detroit).
Does this mean all the No. 1 seeds are going down? No, probably not. But it does indicate they’re very susceptible to being upset—not just in the first round, but in every round of the playoffs.
Vegas odds
Finally, let’s take a look at how these Total figures for each team compare to Vegas. My (extremely unscientific and non-statistically sound) formula for a stat I call “BetFigure” is:
BetFigure = [(Total Differential + 2.5) * 0.2] / Vegas Win Percentage
From my (again, unscientific) experience, anything over 1.50 is generally a profitable bet.
| Team | Line | Win Pct | Total | Opponent | Total | Total Diff | BetFigure |
| Detroit | 235 | 29.9% | 0.356 | Boston | 0.101 | 0.25 | 1.85 |
| Dallas | 165 | 37.7% | 0.289 | Anaheim | -0.575 | 0.86 | 1.78 |
| Columbus | 210 | 32.3% | -0.483 | Pittsburgh | -0.200 | -0.28 | 1.37 |
| Minnesota | 115 | 46.5% | -0.512 | Colorado | -1.171 | 0.66 | 1.36 |
| Chicago | -105 | 51.2% | 0.905 | St. Louis | 0.106 | 0.80 | 1.29 |
| Los Angeles | 125 | 44.4% | 1.233 | San Jose | 0.926 | 0.31 | 1.26 |
| NY Rangers | -150 | 60.0% | 0.753 | Philadelphia | -0.244 | 1.00 | 1.17 |
| Tampa Bay | -117 | 53.9% | 0.018 | Montreal | -0.377 | 0.40 | 1.07 |
| Montreal | -103 | 50.7% | -0.377 | Tampa Bay | 0.018 | -0.40 | 0.83 |
| Pittsburgh | -250 | 71.4% | -0.200 | Columbus | -0.483 | 0.28 | 0.78 |
| San Jose | -145 | 59.2% | 0.926 | Los Angeles | 1.233 | -0.31 | 0.74 |
| Philadelphia | 130 | 43.5% | -0.244 | NY Rangers | 0.753 | -1.00 | 0.69 |
| Colorado | -135 | 57.4% | -1.171 | Minnesota | -0.512 | -0.66 | 0.64 |
| St. Louis | -115 | 53.5% | 0.106 | Chicago | 0.905 | -0.80 | 0.64 |
| Boston | -280 | 73.7% | 0.101 | Detroit | 0.356 | -0.25 | 0.61 |
| Anaheim | -190 | 65.5% | -0.575 | Dallas | 0.289 | -0.86 | 0.50 |
So there you have it, Detroit and Dallas. Take it to the bank. Guaranteed*
*Maybe
